
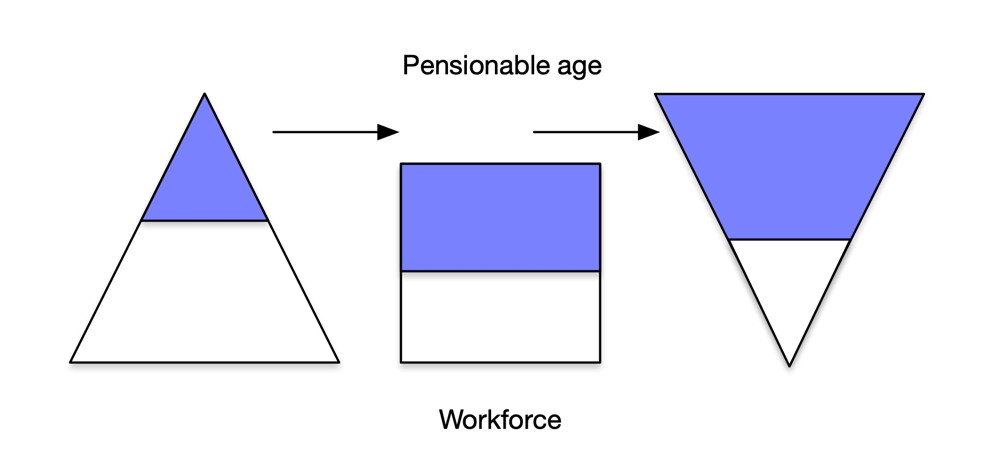
I thought I would post a quick graphic to illustrate the risk of reaching parity between the number of people in pensionable age to that of the remaining workforce, and without more people being born or moving to the area, then the triangle of support could upturn itself.
The first triangle shows a larger workforce that contributes to the county’s funding through taxes, business rates and so on, which ultimately feeds through to social care and healthcare.
All those baby boomers are becoming pensioners and coming out of the potential workforce through retirement. People are living longer so that upper block will get bigger for longer.
Birth rates are lower now. The ONS 2018 birth figures show that there has been a 9.9% decrease in the number of annual births from 2012 to 2018. People are having less children and having them later, well that’s my guess as I haven’t pulled a specific stat on that yet.
So, the bottom part is getting smaller and smaller with the risk that there isn’t enough underneath to support what is above. A simplistic view I know, but that’s what is needed at this time to show what the future can become.
Hypothetically, you could have half the workforce producing the same GVA, through the wonders of AI, automation and the new world of work that we don’t know about yet. OK, let’s assume that could be true, we still need people working in health and social care to support those that are living longer, with ailments that need continual management.
But what do you think?
<update>
BBC article suggests global fertility rate is going to crash.